Service graphs
|
|
|
|
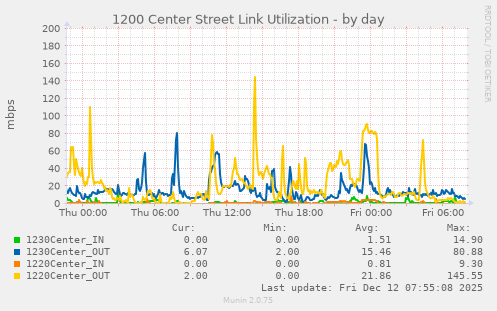
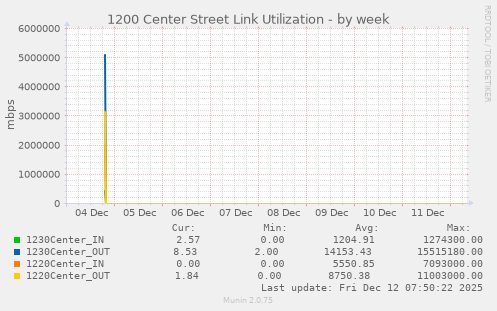
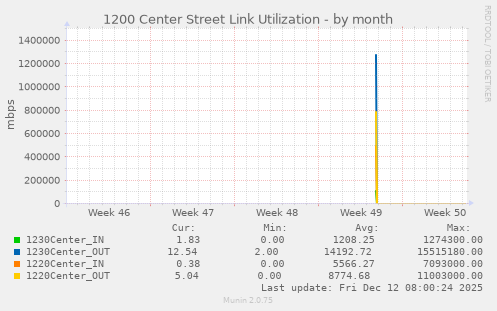
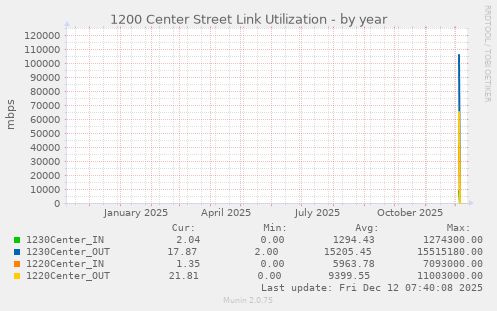
Graph Information
This graph shows the utilization per interface on the 1240 center street in mbps.
| Field | Internal name | Type | Warn | Crit | Info |
|---|---|---|---|---|---|
| 1230Center_IN | users1 | gauge | |||
| 1230Center_OUT | users2 | gauge | |||
| 1220Center_IN | users3 | gauge | |||
| 1220Center_OUT | users4 | gauge |