Service graphs
Graph Information
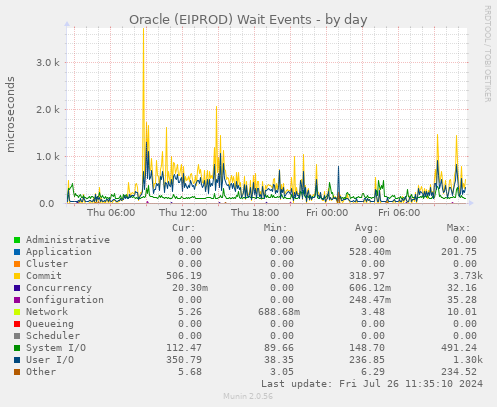
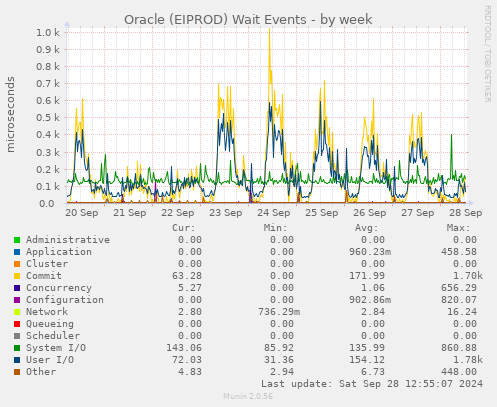
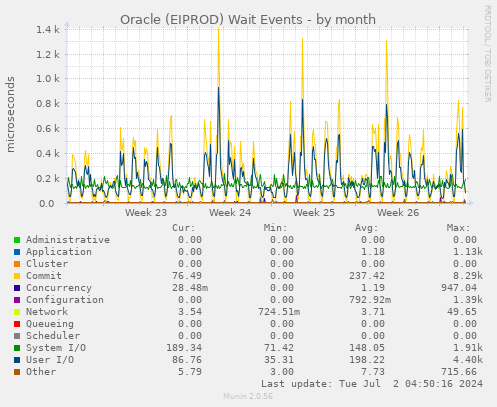
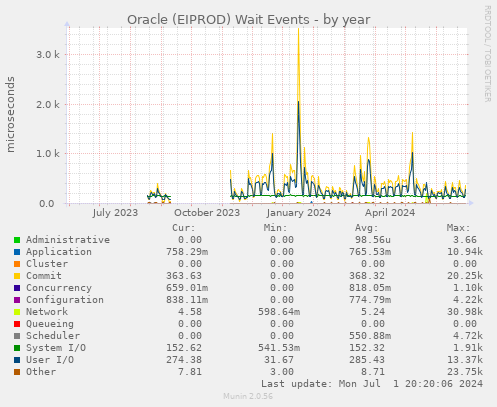
Oracle Wait Events - It may look weird that Y-axis indicates 'microseconds per second'. Although number of times of wait event looks easier to understand, in many cases the number of events does not matter, but wait time become more important to analyze bottle necks.
| Field |
Internal name |
Type |
Warn |
Crit |
Info |
| Administrative |
Administrative |
derive |
|
|
|
| Application |
Application |
derive |
|
|
|
| Cluster |
Cluster |
derive |
|
|
|
| Commit |
Commit |
derive |
|
|
|
| Concurrency |
Concurrency |
derive |
|
|
|
| Configuration |
Configuration |
derive |
|
|
|
| Network |
Network |
derive |
|
|
|
| Queueing |
Queueing |
derive |
|
|
|
| Scheduler |
Scheduler |
derive |
|
|
|
| System I/O |
System_I_O |
derive |
|
|
|
| User I/O |
User_I_O |
derive |
|
|
|
| Other |
Other |
derive |
|
|
|


